Hospital Break-Even Occupancy: A 50-Bed Calculator
Published
Every doctor who has thought about starting a hospital has been shown a project report with a line that says "break-even at 60% occupancy in year two". Very few reports show how that number was reached, which costs it assumes, or what happens to it if a third of your patients arrive on a government scheme instead of with insurance.
This article is for promoters and doctor-entrepreneurs planning or running a hospital of around 50 beds. It explains the arithmetic behind break-even occupancy, works through one example with every assumption shown, and gives a sensitivity check and a spreadsheet layout you can rebuild with your own numbers.
Every number in this article is an assumption for illustration. None of it is a forecast, a benchmark or a promise about what a hospital will earn. Your city, specialities, building cost and payer mix will give different answers.
Fixed vs variable costs in a hospital
The first step is sorting costs by how they behave when occupancy changes.
Fixed costs stay roughly the same whether 20 or 45 beds are occupied this month:
- Salaried staff: nurses, resident doctors, technicians, pharmacists, front office, housekeeping, security, administration
- Rent or lease, or loan interest on the building
- Equipment loan payments or lease rentals
- Baseline utilities: power for lighting, air conditioning, lifts, the DG set, water
- AMC and CMC contracts, licences, insurance, software subscriptions
- Administration and marketing overheads
Variable costs move with each occupied bed-day or each procedure:
- Drugs, consumables and implants
- Fee-for-service payouts to visiting consultants
- Food and linen for inpatients
- Lab reagents and outsourced tests
- Biomedical waste charges
Hospitals are heavy on fixed cost, mainly because of staff. In a published costing study of Indian public-sector secondary hospitals, salaries made up more than half of annual cost: 57% at community health centres and 62% at district hospitals. Private hospitals differ, but the lesson carries over: most of your monthly spend arrives whether the beds are full or not.
Revenue per bed-day by payer mix
The revenue side is usually expressed as revenue per occupied bed-day, which listed hospital groups report as ARPOB (average revenue per occupied bed). Occupancy is normally defined as occupied beds divided by operational beds; KIMS's investor presentation, for example, states it as "Occupied Beds/Operational Beds". Definitions vary slightly between groups, so read the footnotes before comparing your numbers to anyone else's.
For a break-even model, the key point is that revenue per bed-day differs a lot by payer. Our illustrative figures for a 50-bed multispeciality hospital:
- Cash / self-pay: ₹22,000 per occupied bed-day
- Insurance / TPA (after typical deductions): ₹20,000
- Corporate and PSU credit: ₹16,000
- Government scheme packages (PM-JAY, state schemes): ₹9,000
Scheme packages are fixed bundled prices set by the scheme. India's Costing of Health Services in India (CHSI) study was set up to generate reference unit costs from public and private hospitals to inform those package prices. Whatever the national evidence, the only cost that matters to your break-even is your own.
One detail: if you have rooms above ₹5,000 a day, the 5% GST on those room charges is collected for the government and is not revenue. Model revenue net of GST.
The break-even formula
Break-even occupancy is where the contribution from occupied bed-days covers fixed costs.
- Contribution per bed-day = ARPOB × (1 − consultant payout %) − other variable cost per bed-day
- Break-even bed-days per month = monthly fixed costs ÷ contribution per bed-day
- Break-even occupied beds per day = break-even bed-days ÷ days in the month
- Break-even occupancy = break-even occupied beds ÷ operational beds
Worked example: a 50-bed hospital (illustrative)
Assumed monthly fixed costs:
- Salaried staff: ₹38 lakh
- Building rent or interest: ₹8 lakh
- Equipment loans and leases: ₹6 lakh
- Baseline utilities: ₹4 lakh
- AMC, licences, insurance, software: ₹2.5 lakh
- Administration and marketing: ₹1.5 lakh
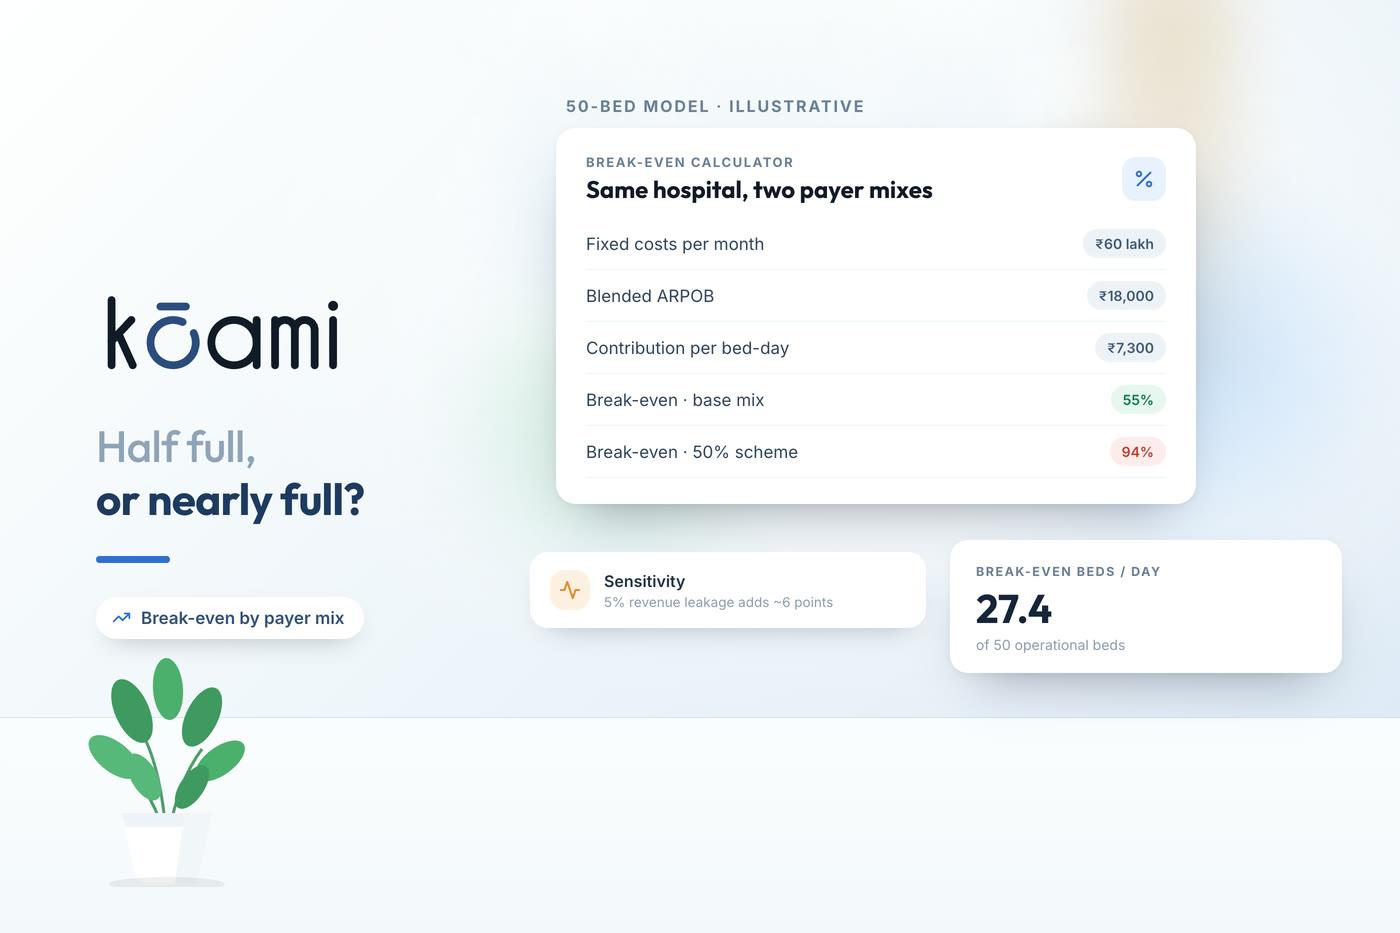
- Total: ₹60 lakh a month
Assumed payer mix: 30% cash, 40% insurance, 10% corporate, 20% scheme.
- Blended ARPOB = 0.30 × 22,000 + 0.40 × 20,000 + 0.10 × 16,000 + 0.20 × 9,000 = ₹18,000
- Consultant fee-for-service payouts: 15% of revenue
- Other variable cost (drugs, consumables, food, linen, lab, waste): ₹8,000 per bed-day
- Contribution per bed-day = 18,000 × 0.85 − 8,000 = ₹7,300
- Break-even bed-days = 60,00,000 ÷ 7,300 = about 822 a month
- Break-even occupied beds = 822 ÷ 30 = about 27.4 a day
- Break-even occupancy = 27.4 ÷ 50 = about 55%
Break-even is not a property of the building. It is a property of your costs, your prices and who pays you.
Sensitivity: what if the payer mix shifts to schemes?
This is where most project reports go quiet. Keep fixed and variable costs the same and change one thing at a time.
- Base case (30/40/10/20 mix): contribution ₹7,300; break-even about 55%.
- Scheme share rises to 50% (15% cash, 25% insurance, 10% corporate, 50% scheme): blended ARPOB ₹14,400; contribution 14,400 × 0.85 − 8,000 = ₹4,240; break-even about 1,415 bed-days a month, or about 94%.
- Fixed costs 10% higher (₹66 lakh): break-even about 60%.
- 5% revenue leakage from missed charges and claim deductions (ARPOB ₹17,100): contribution ₹6,535; break-even about 61%.
- Variable cost ₹1,000 lower per bed-day through tighter consumable control: contribution ₹8,300; break-even about 48%.
Read the second line again. In this illustrative model, the same hospital that breaks even at about half full needs to be almost full if half its patients move to scheme packages, unless its costs for those patients are much lower. In practice, scheme cases often have different case mixes and lengths of stay, so model them as a separate line rather than assuming one variable cost for everyone.
The other lesson is that small leaks add up. Five percent of revenue lost to missed charges and claim deductions moves break-even by about six percentage points in this example, roughly three more occupied beds every day.
Length of stay changes the picture
Occupancy measures bed-days, not patients. If average length of stay falls from 4 days to 3.5 days with the same number of admissions, occupancy falls too, even though you treated the same patients. Whether that hurts depends on how you are paid:
- On itemised billing, revenue per bed-day often stays similar, so fewer bed-days means less revenue unless freed beds are filled.
- On package billing, the package pays the same regardless of stay, so a shorter stay improves contribution per case and frees a bed for the next admission.
When you model a scheme-heavy mix, model packages per case and the length of stay behind them, not just a per-day figure.
Where software spending fits
Software is a fixed cost like any other. In this example, ₹1 lakh a month of extra fixed cost adds about 14 break-even bed-days a month, or roughly one percentage point of occupancy. That is the bar a system has to clear: it must recover more than its cost through captured charges, fewer claim deductions, lower consumable wastage or staff time. Ask any vendor, including us, to show which line of your model their system is expected to move, and measure it after go-live. Our guides on hospital software cost, HMIS ROI and charge capture go into those lines.
Calculator: how to build and use it
You can rebuild the model in any spreadsheet in about fifteen minutes. A layout that works:
Inputs (one column, clearly labelled)
- Operational beds
- Days in the month
- Monthly fixed costs, as separate lines (staff, building, equipment, utilities, AMC/licences/software, admin and marketing)
- Payer mix percentages (must total 100%)
- ARPOB for each payer, net of GST
- Consultant payout as a % of revenue
- Other variable cost per bed-day (or one per payer if you have the data)
- Monthly OPD and day-care contribution (optional)
Formulas
- Total fixed costs = sum of the fixed lines
- Blended ARPOB = sum of (payer share × payer ARPOB)
- Contribution per bed-day = blended ARPOB × (1 − payout %) − variable cost per bed-day
- Net fixed costs = total fixed costs − OPD and day-care contribution
- Break-even bed-days = net fixed costs ÷ contribution per bed-day
- Break-even occupancy = break-even bed-days ÷ (operational beds × days)
How to use it
- Fill in actuals from the last three months, not the project report.
- Change one input at a time and note the break-even each time.
- Add a cash view: loan repayments as an extra fixed line, and a receivables delay for scheme and insurance dues.
- Revisit monthly. Break-even moves whenever salaries, tariffs or payer mix move.
Getting the inputs from real data
The model is only as good as its inputs. Most hospitals can estimate fixed costs from accounts. The harder numbers are ARPOB by payer, variable cost per bed-day and length of stay by scheme, which need inpatient billing, pharmacy issues and bed census to be linked to the same admission. When admissions, billing, pharmacy and the bed board run on one system, those figures come from the bills themselves rather than from a spreadsheet someone fills in at month-end. Kōami's analytics can break revenue and consumption down by payer and admission, which is what this calculator needs.
This article is a planning aid, not financial advice. Get a chartered accountant or healthcare finance adviser to review any feasibility study before you commit capital.
If you want to see revenue, consumption and occupancy by payer from one connected system, book a demo.
Frequently asked questions
- What is break-even occupancy for a hospital?
- It is the bed occupancy at which the contribution from inpatient bed-days (revenue minus variable costs) exactly covers the hospital's fixed costs for the period. Below it the hospital loses money on operations; above it each extra occupied bed-day adds to profit.
- What is a good break-even occupancy for a 50-bed hospital?
- There is no standard figure. It depends on your fixed costs, revenue per bed-day, variable costs and payer mix. In this article's illustrative model it is about 55%, but the same hospital needs over 90% if half its patients move to lower-priced scheme packages. Run the calculation with your own numbers.
- How do government scheme patients affect break-even?
- Scheme packages usually pay less per bed-day than cash or insurance patients, while the variable cost of treating the patient does not fall by the same amount. Contribution per bed-day falls, so you need more occupied bed-days to cover the same fixed costs.
- Should outpatient revenue be included in a break-even calculation?
- Yes, if it is material. A simple way is to subtract OPD and day-care contribution from monthly fixed costs before dividing by inpatient contribution per bed-day. Keep it explicit so you can see how much the inpatient side has to carry.
- Is the break-even figure the same as cash break-even?
- No. An operating break-even covers running costs. If you add loan repayments and allow for receivables that take months to arrive, especially scheme and insurance dues, the occupancy you need to stay cash-positive is higher.
Sources
- Prinja S et al., Cost of Delivering Secondary Healthcare Through the Public Sector in India, PharmacoEconomics Open, 2020
- Prinja S et al., Establishing reference costs for the health benefit packages under AB-PMJAY: CHSI study protocol, BMJ Open, 2020
- KIMS (Krishna Institute of Medical Sciences) investor presentation, Q3 FY26 (ARPOB and occupancy definitions)
- Notification No. 03/2022-Central Tax (Rate): 5% GST without ITC on room charges above Rs 5,000 per day
Follow Kōami on LinkedIn
Get the next guide on hospital operations, software and compliance in your feed, as soon as it is published.