The Twelve Cycle Times That Actually Run a Hospital
Published
Hospitals measure a great deal and act on very little of it. Part of the reason is that most hospital reporting is composed of counts and averages — patients seen, revenue booked, occupancy percentage — and counts tell you what happened without telling you where to intervene.
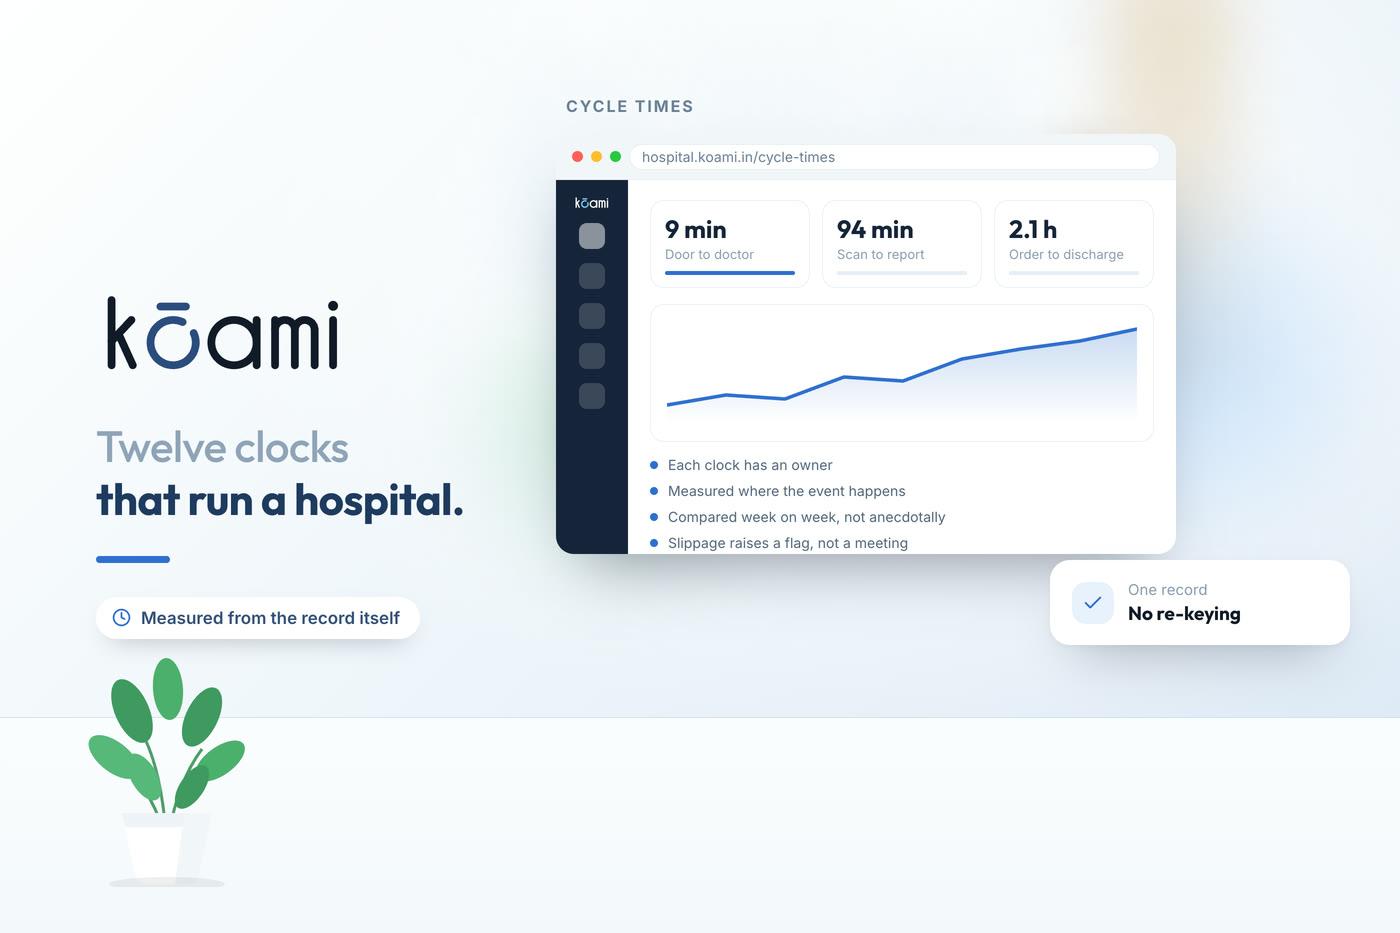
Cycle times are different. A cycle time is an interval with a start, an end and an owner, which means that when it moves in the wrong direction there is a specific person who can do something about it. This is a list of the twelve worth running a hospital on, what each one is really telling you, and where to look when it degrades.
Why measure intervals instead of counts?
Because an interval has an owner and a cause, and a count has neither.
Occupancy at eighty-four percent is a fact you cannot act on. Time from discharge decision to bed ready at four hours and ten minutes is a fact with three named owners — the ward, billing and housekeeping — and a set of handoffs you can go and watch.
Two rules make the difference between a dashboard that changes behaviour and one that gets ignored. Report the ninetieth percentile alongside the median, because queues are created by the tail rather than the typical case. And report by hour or by day of week rather than as a monthly average, because the failure is almost always concentrated in specific hours.
The patient-flow cycle times
1. Door to triage, and door to doctor in casualty. The purest waiting interval in the hospital and the leading indicator for everything downstream. When it lengthens, look at registration policy first and at boarding second. See door-to-doctor time in casualty.
2. OPD appointment time to consultation start. The gap between the time you promised and the time you delivered. Track it against scheduled slot rather than arrival, otherwise early arrivals flatter the number. See cutting the OPD wait with token and queue.
3. Admission decision to bed occupancy. Measures how well bed state, housekeeping and admissions coordinate. A long interval here nearly always means bed status is maintained by phone. See live bed management.
4. Discharge decision to bed vacated. The most valuable interval in the hospital, because every hour recovered is an hour of bed capacity created at no cost. Owned jointly by the ward, pharmacy and billing. See admission to discharge.
5. Bed vacated to bed ready. Housekeeping's interval, and the one most often invisible because nobody records the two timestamps.
A hospital that can state its median and ninetieth-percentile discharge-decision-to-bed-ready time, by ward, already runs better than one that cannot, regardless of what the number is.
The diagnostic and clinical cycle times
6. Lab order to result available. Split it: order to collection, collection to receipt, receipt to result, result to verification. The step that fails is usually collection rounds not matching ward round timing. See turnaround time, the metric that runs a lab.
7. Imaging order to signed report available. Measure to availability to the ordering clinician, not to signature. Segment it, because the front end and the back end fail for different reasons. See radiology report turnaround.
8. Critical result identified to acknowledged. Not sent — acknowledged, by a named person. This is a patient safety measure before it is an efficiency one, and NABH will ask for it. See closing the loop on critical results.
9. Theatre list start delay and turnaround between cases. First-case start delay is a discipline measure; inter-case turnaround is a coordination measure. They have different fixes and should not be averaged together. See scheduling the operating theatre without collisions.
The revenue cycle times
10. Discharge decision to final bill. Almost entirely determined by whether charges were captured as care happened. Watch the count of charge postings made after the discharge decision — that is the real number. See cutting hospital billing time.
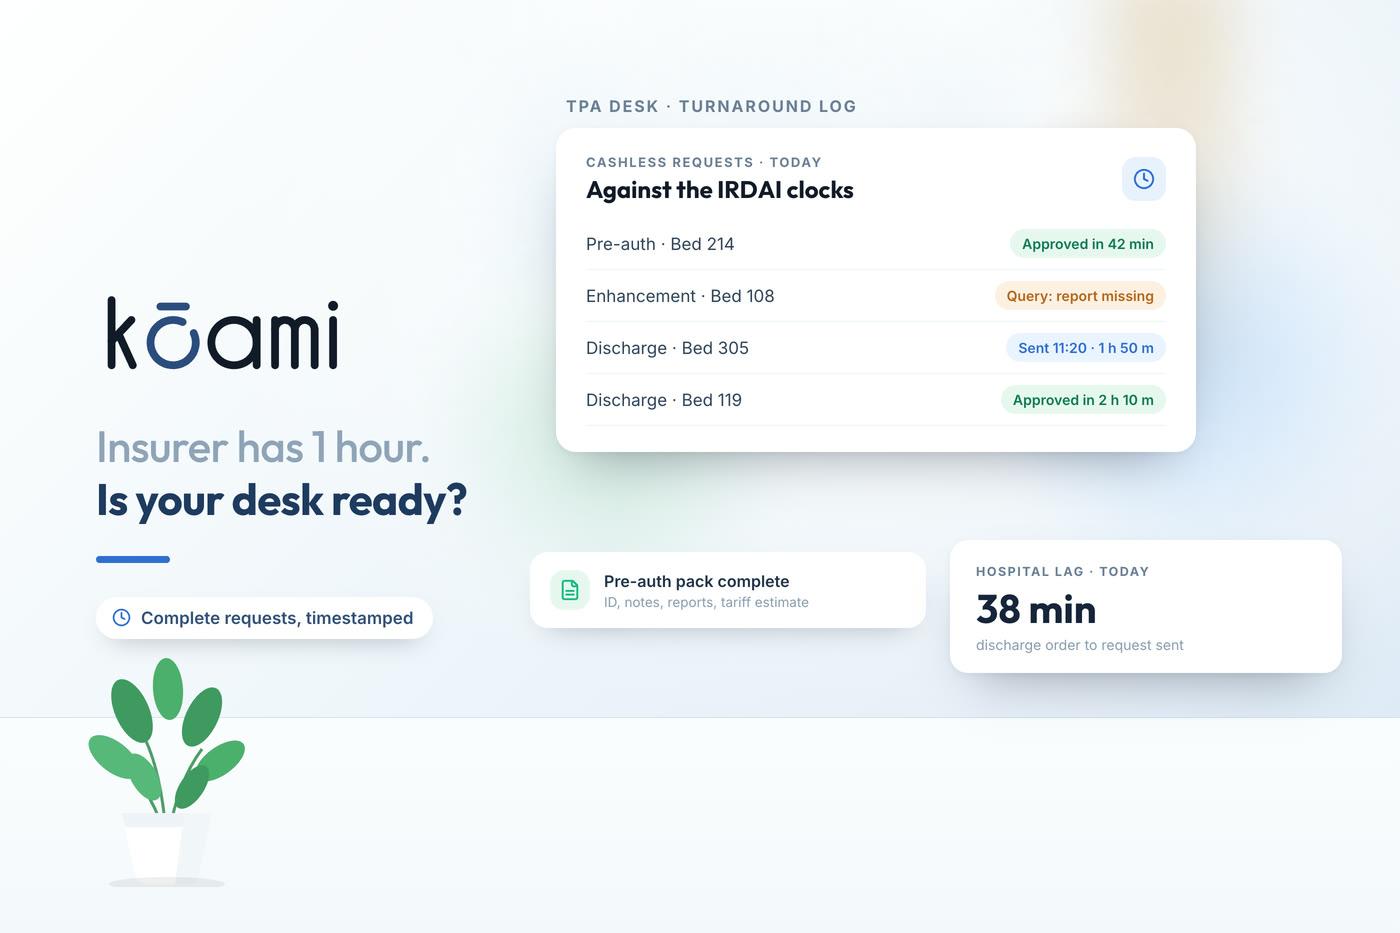
11. Discharge to claim submission, and query to resubmission. Two intervals, both owned by the hospital, and together usually a larger share of receivables ageing than payer processing. See cutting claim settlement time.
12. Prescription to dispense at the pharmacy counter. The last impression a patient takes home, and mostly a prescribing and stock design problem rather than a staffing one. See the pharmacy counter queue.
What targets should a hospital set?
Set your first target from your own ninetieth percentile, not from a published benchmark.
Benchmarks from other health systems are interesting and rarely applicable: case mix, staffing models, payer structures and physical layouts differ too much. What works is to measure your own distribution for a month, take the ninetieth percentile, and aim to bring it toward your current median. That is a target derived from what your own hospital already achieves on a good day, which makes it both credible to staff and demonstrably achievable.
Then re-baseline. A target that has been met and held for a quarter should be replaced.
Which of the twelve should a hospital start with?
Discharge decision to bed vacated, because it improves capacity, revenue and patient experience at once, and because fixing it forces you to fix several others.
The chain it depends on runs through pharmacy reconciliation, ward consumption, billing, payer approval and housekeeping. A hospital that genuinely shortens this interval has necessarily improved charge capture, pharmacy returns, insurance handling and bed state along the way. No other single interval has that reach.
Second, whichever of the twelve your staff complain about most. The complaint is data, and fixing something people already find painful buys the credibility needed for the rest.
How Kōami produces these numbers
The reason most hospitals cannot report these intervals is not that the software lacks a dashboard. It is that the two timestamps that define an interval live in different systems, or one of them is never recorded at all.
Kōami Hospital records both ends of most of these intervals as part of the workflow rather than as an extra step:
- Registration, triage, ADT, orders, results, billing and discharge are events on one record, so patient-flow intervals are read rather than reconstructed.
- Lab order, sample collection, result entry and approval are tracked with TAT reporting built into the laboratory module, and analyser interfacing removes the manual result-entry step that distorts it.
- Kōami PACS reports study volume, turnaround, modality mix and radiologist productivity, with a critical-results queue that tracks acknowledgement rather than dispatch.
- Charges captured at the point of care mean the discharge-to-bill interval is short by construction, and the count of late postings is visible rather than anecdotal.
- Kōami Inventory supplies consumption, stock-out and wastage data behind the pharmacy and ward intervals.
- Kōami Workforce supplies roster coverage, overtime and time-to-fill, which is what explains an interval that degrades at a particular hour.
- Kōami Field Service tracks equipment downtime and SLA breaches, which is frequently the hidden cause behind a theatre or imaging delay nobody could account for.
Start by choosing three of the twelve and measuring them honestly for a month, before changing anything. If the timestamps do not exist in your current systems, that is itself the finding, and it is worth bringing to a demo.
Follow Kōami on LinkedIn
Get the next guide on hospital operations, software and compliance in your feed, as soon as it is published.