The Five Numbers a Center Head Checks First
Published
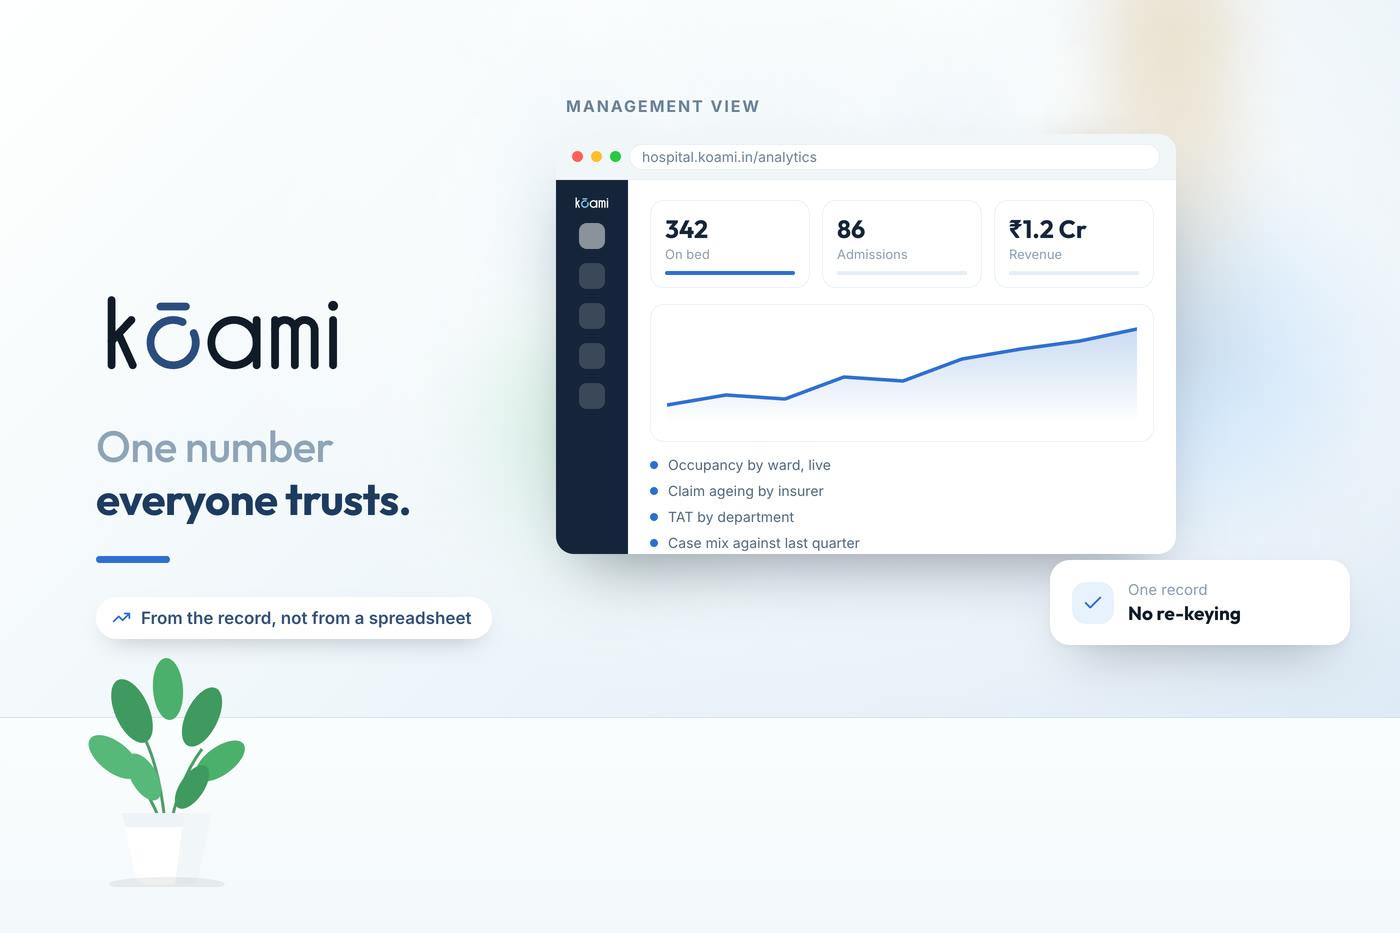
A center head running a hospital or a diagnostic chain has access to hundreds of metrics and time to look at perhaps five. The dashboards built for them usually get this exactly backwards, presenting fifty tiles of equal weight in the hope that the important ones are in there somewhere. They are, and they are drowned. The skill in management information is not collecting more numbers; it is knowing which handful a leader should check before their first cup of tea, and making those numbers honest, current, and impossible to misread. Here are the five that consistently earn their place.
One: Today's Revenue Against the Run Rate
The first number is money, but not as a raw figure. A revenue total on its own tells you almost nothing, because you have no idea whether it is good until you compare it to something. What a center head actually needs is today's revenue against the pace required to hit the month's target, and against the same day last month and last year.
- Revenue to date this month, against the target, so the leader knows if they are ahead or behind with enough of the month left to react.
- The daily run rate, because a month that started strong and is fading looks fine on a cumulative chart and terrible on a daily one.
- The mix - OPD, IPD, diagnostics, pharmacy - because a revenue number that is holding up on pharmacy while OPD collapses is a warning dressed as good news.
Kōami presents revenue as pace-against-plan rather than a bare total, which is the difference between a number you glance at and a number you can act on.
Two: Occupancy and Throughput
The second number is utilisation, and which form it takes depends on the business. For an inpatient facility it is bed occupancy. For a diagnostic center it is throughput - studies per modality, tests per bench. The underlying question is the same: are the expensive assets being used, and where is the constraint.
- Occupancy by ward or utilisation by modality, so an idle CT scanner or a full ICU is visible before anyone has to ask.
- The trend, not just today's snapshot, because occupancy drifting down over two weeks is a commercial problem forming quietly.
A dashboard that shows today's occupancy but not last fortnight's trend tells a leader where they are and hides where they are going.
Kōami ties utilisation to the trend so the center head sees direction, not just position.
Three: The Cash Conversion Signal
The third number is the one that separates a business that looks profitable from one that actually has cash: how fast billed revenue turns into collected money. A center can post strong revenue and still be starved of cash if claims are stuck in TPA queues and receivables are ageing.
- Days in accounts receivable, trending, because a rising number here is cash quietly leaving the building.
- The first-pass claim rate, since claims that bounce are revenue that has been earned but not collected, and every bounce lengthens the cash cycle.
- The ageing bucket - what share of receivables is over ninety days - because old receivables are the ones most likely to become bad debt.
Kōami surfaces the collection health alongside the revenue, so a leader never mistakes billing for banking. Revenue is a promise; collection is the fulfilment, and the gap between them is where businesses get into trouble.
Four: The Quality Signal That Cannot Be Gamed
Every leader needs one number that speaks for the patient, and it has to be one that resists being gamed by the people whose work it measures. Depending on the setting, that is average turnaround time for a lab, or average length of stay against expected for a hospital, or the wait time from registration to consultation for an OPD.
- A service metric the patient actually feels - TAT, wait time, or length of stay - reported as a distribution rather than a flattering average.
- Against a target, so the leader sees not just the value but whether it is acceptable, and whether it is drifting.
The reason this belongs in the top five is that commercial numbers and quality numbers pull against each other, and a leader who watches only the money will optimise the business into a place patients quietly stop coming back to. Kōami keeps a patient-experience metric on the same board as the revenue, so the trade-off is visible and deliberate rather than accidental.
Five: The Exception That Needs a Person
The fifth item is not a metric at all; it is the exception list. The first four numbers tell a leader how the business is doing. The fifth tells them what needs a human decision today - the things that have crossed a threshold and are waiting for someone with authority.
- Critical stockouts - the items that will run out within the lead time and threaten clinical care.
- Escalations - the complaint, the denied high-value claim, the credit request that exceeds a manager's limit.
- Anomalies - a revenue figure or a volume that has moved far enough from normal to warrant a look, flagged by the system rather than hunted for by the leader.
Kōami surfaces these as an actionable exception queue, because the highest-value thing a leader can do in the morning is not admire a chart but resolve the two things that only they can resolve.
The discipline of a good management dashboard is subtraction, not addition. Any competent system can show a center head five hundred numbers; the useful ones show five and make them trustworthy. Pace against plan, utilisation with its trend, the cash conversion signal, a quality metric that cannot be gamed, and the short list of exceptions that need a person. A leader who checks those five before the day begins knows where the business stands, where it is heading, and what only they can fix - and that is genuinely all the morning requires.
Follow Kōami on LinkedIn
Get the next guide on hospital operations, software and compliance in your feed, as soon as it is published.