Turnaround Time: The Metric That Runs a Lab
Published
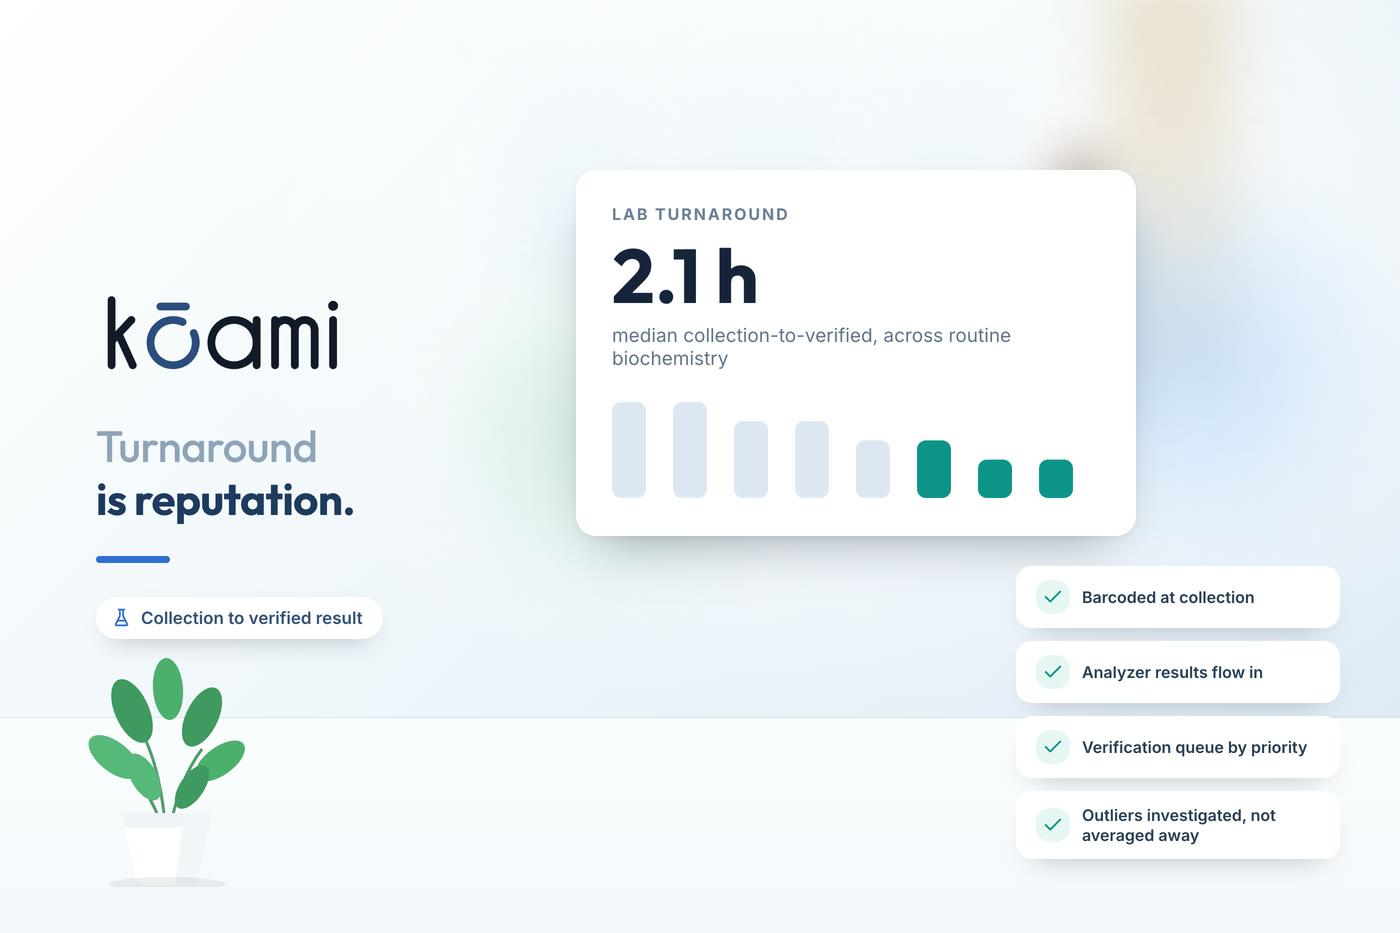
Ask a lab director what single number they would keep if they could keep only one, and a surprising share will say turnaround time. Not accuracy, which they take as non-negotiable, and not volume, which is a business input. Turnaround time, because TAT is the number that a clinician on the ward actually feels, the number that determines whether a result changes a decision or arrives too late to matter. A potassium result that is perfectly accurate and four hours late did not help the patient in front of the doctor. TAT is where the lab's quality meets the hospital's reality.
Decide What You Are Actually Measuring
The first argument in any TAT project is about definitions, and it is worth having properly because a metric everyone measures differently is a metric nobody can improve. "Turnaround time" can mean any of several intervals, and they behave completely differently.
- Order-to-result - from the moment the clinician places the order to the moment the verified result is available. This is what the clinician experiences and arguably the only number that matters to them.
- Collection-to-result - from sample draw to result, which excludes the delay in getting a phlebotomist to the patient.
- Receipt-to-result - from the sample arriving in the lab to the verified result, which is the interval the lab actually controls.
Each is legitimate, and a serious lab tracks more than one, because the gap between them is diagnostic. If order-to-result is terrible but receipt-to-result is excellent, your problem is in phlebotomy and transport, not in the lab. Kōami timestamps each of these transitions, so the total interval can be decomposed instead of argued about.
If you only measure receipt-to-result, you will optimise the one part of the journey the clinician never sees and wonder why they still complain.
The Median Lies, the Tail Tells the Truth
The second mistake is reporting TAT as an average. A mean is dragged around by outliers and hides the shape of the distribution, and the shape is the whole story. What a clinician remembers is not the average result; it is the one that took six hours when they needed it in one. So report percentiles.
- The median tells you the typical experience, which is useful for capacity planning.
- The 90th percentile tells you what a bad day looks like, and it is the number that generates the complaints.
- The maximum, examined case by case, is where you find the sample that got lost on a trolley, the analyzer that went down, the result that failed verification and sat in a queue.
Chasing the median down while ignoring the tail produces a lab that looks good on the dashboard and feels unreliable on the ward. The improvement work lives in the tail. Kōami reports TAT as a distribution with percentiles rather than a single reassuring average, because the average is the number that hides the problem.
Break the Journey Into Steps You Can Fix
A long TAT is never one delay; it is an accumulation of small ones, and you cannot fix what you cannot see. The path from order to result has distinct stages, and instrumenting each transition tells you where the time actually goes.
- Pre-analytical: order placed, sample collected, sample transported, sample received and accessioned. In most labs this is where the largest and most fixable delays hide - a sample waiting for the next transport run, a mislabelled tube sent back for recollection.
- Analytical: sample loaded, instrument run, result produced. This is usually the fastest and most stable stage, which is why labs that only look here run out of things to improve.
- Post-analytical: result verified, critical values called, report released. A result that waits in an unattended verification queue is a post-analytical delay masquerading as a slow lab.
When you can see that forty minutes of a ninety-minute TAT is transport, you stop buying faster analyzers and start fixing the transport schedule. Kōami's step-level timestamps make that decomposition visible, which is what turns a vague complaint into a specific fix.
Make TAT a Live Signal, Not a Monthly Report
A TAT report that arrives on the fifth of next month tells you about problems you can no longer do anything about. To actually run a lab, TAT has to be a live signal that lets a supervisor intervene while the sample is still in the building.
- Flag samples that are approaching their TAT target while there is still time to expedite them, not after they have breached.
- Segment targets by priority, because a STAT troponin and a routine lipid panel should never be held to the same clock.
- Watch the queues in real time, so a verification backlog building at shift change is visible before it becomes an hour of delayed results.
Kōami surfaces in-flight samples against their targets so a supervisor can act on the sample that is running late today, not read about it next month. That shift - from retrospective reporting to live management - is what makes TAT a metric that runs the lab rather than merely grades it.
Turnaround time endures as the lab's master metric because it refuses to let the lab grade itself in isolation. It ties the bench to the bedside and insists that a result only counts when it arrives in time to be used. Measure it honestly, by the right interval and the right percentile, break the journey into steps you can actually change, and make it a live signal a supervisor can act on. Do that and TAT stops being a number you report and becomes the number that runs the place.
Follow Kōami on LinkedIn
Get the next guide on hospital operations, software and compliance in your feed, as soon as it is published.