NABH Quality Indicators List: 32 KPIs, Formulas, Sources
Published
On the fifth working day of every month, the quality office in a typical 150-bed hospital becomes a collection centre. The NABH coordinator chases fourteen department heads, receives eleven Excel files in nine layouts, re-types numbers from a nursing register, and finds that the ICU counted ventilator days differently in August and September. By the time the committee meets, the numbers are three weeks old and nobody fully trusts them. The problem is rarely the indicator. It is that each data point has no fixed home.
Below is a working formula sheet for the 32 indicators in the NABH 6th edition hospital standard: numerator, denominator, unit, and where in your HIMS or registers each number should come from.
How the 6th edition treats indicators
The 6th edition of the NABH Accreditation Standards for Hospitals has been effective since 1 January 2025. Indicators sit in Chapter 6, Patient Safety and Quality Improvement (PSQ). Standard PSQ.3 asks the hospital to identify and monitor key indicators across four areas, and the annexure tags each indicator to one of them:
- PSQ.3.a: clinical structures, processes and outcomes
- PSQ.3.b: infection prevention and control
- PSQ.3.c: managerial structures, processes and outcomes
- PSQ.3.d: patient safety
The same standard goes further than collection. PSQ.3.e asks that the quality team verifies the data regularly, PSQ.3.f asks for a mechanism of analysis that identifies opportunities for improvement, and PSQ.3.g asks that improvements are implemented and evaluated. An assessor will look for all three, not just a filled sheet.
The Key Performance Indicators annexure at the back of the standard gives a standardised definition, formula, unit, frequency and remarks for each indicator, along with guidance on how the data could be captured from the HIS or EMR. Two lines in its introduction matter for automation. Where the system cannot collate a numerator or denominator, there should at minimum be a manual-entry provision so the value is still calculated automatically. And department-specific indicators are captured from in-patients unless stated otherwise. NABH's training page describes the set as 32 mandatory organisational KPIs and 18 department-specific clinical indicators, the latter applying when that specialty is in your scope.
Treat the annexure in your copy of the standard as the authority. This sheet paraphrases it to show where the data lives; reconcile every definition against the published text before you build reports on it.
The formula sheet: 32 indicators and their data sources
Each line gives formula, unit and data source. Collation is monthly unless marked.
Clinical indicators (PSQ.3.a)
- Time for initial assessment of indoor patients: sum of minutes from arrival at the ward bed to the doctor's completed initial assessment, divided by total admissions (day care excluded); minutes; source: ADT bed-arrival time stamp and EMR initial assessment completion time stamp
- Reporting errors per 1,000 investigations: reporting errors divided by tests performed, x 1,000; per 1,000 tests; source: LIS and RIS amendment logs for reports changed after release
- Adherence to safety precautions in diagnostics: staff adhering divided by staff audited, x 100; percentage; source: monthly audit form completed by someone outside the department
- Incidence of medication errors: medication errors divided by opportunities, x 100; percentage; source: incident module plus eMAR, using NABH's medication error methodology
- In-patients developing adverse drug reactions: ADRs divided by in-patients, x 100; percentage; source: ADR reports (the annexure notes PvPI's VigiFlow can be used)
- Unplanned return to OT: unplanned returns divided by patients operated in OT, x 100; percentage; source: OT scheduler and OT notes, reported with a 30-day delay
- Adherence to procedures preventing wrong site, wrong patient, wrong surgery: surgeries where the WHO safe surgery checklist was followed divided by surgeries audited, x 100; percentage; source: prospective audit in the OT
- Transfusion reactions: transfusion reactions divided by units transfused (not issued), x 100; percentage; source: blood bank transfusion and reaction records
- Standardised mortality ratio for ICU: actual ICU deaths divided by predicted deaths (APACHE, SOFA, SAPS or similar); ratio; source: ICU scoring captured at admission plus ICU discharge outcomes
- Return to ICU within 48 hours: returns within 48 hours divided by ICU discharges or transfers out, x 100; percentage; source: ADT transfer history (all ICUs, HDUs excluded)
- Return to emergency within 72 hours with similar complaints: such returns divided by emergency patients, x 100; percentage; source: ED registration with a prior-visit flag at triage
- Hospital-associated pressure ulcers after admission: new or worsening pressure ulcers divided by in-patient days, x 1,000; per 1,000 patient days; source: nursing skin assessment (EPUAP and NPUAP staging) and the midnight census
- Surgical site infection rate: SSIs divided by surgeries performed that month, x 100; per 100 procedures; source: infection control surveillance linked to OT records, using CDC NHSN definitions
Infection control indicators (PSQ.3.b)
- CAUTI rate: catheter-associated UTIs divided by urinary catheter days, x 1,000; per 1,000 catheter days; source: device insertion and removal entries in nursing charting
- VAP rate: ventilator-associated pneumonias divided by ventilator days, x 1,000; per 1,000 ventilator days; source: ICU ventilator log
- CLABSI rate: central line-associated bloodstream infections divided by central line days, x 1,000; per 1,000 line days; source: line insertion and removal entries
- Hand hygiene compliance: hand hygiene actions performed divided by opportunities observed, x 100; percentage; source: direct observation audit (WHO monitoring tool)
- Appropriate surgical prophylaxis within the time frame: patients who received the appropriate drug and dose on time divided by patients operated, x 100; percentage; source: anaesthesia record and medication administration time against incision time, judged against hospital policy
Managerial indicators (PSQ.3.c)
- Rescheduling of surgeries: cases rescheduled (cancelled or postponed beyond 4 hours) divided by surgeries planned, x 100; percentage; source: OT list including tentative bookings, measured from the first booked time
- Turnaround time for issue of blood and components: sum of minutes from request received to cross-matched and available, divided by units cross-matched or reserved; minutes; source: blood bank request and release time stamps
- Nurse-patient ratio for ICUs and wards: nursing staff divided by occupied beds, calculated per shift, in-charge excluded; ratio; source: duty roster and live census (the annexure sets this as continuous, not monthly)
- Waiting time for outpatient consultation: sum of minutes from arrival at the OPD (or appointment time) until the consultant begins, divided by outpatients; minutes; source: OPD queue arrival and consultation start time stamps
- Waiting time for diagnostics: sum of minutes from requisition presented at the counter (or appointment time) until the test starts, divided by outpatients reported; minutes; source: LIS and RIS counter and procedure-start time stamps
- Time taken for discharge: sum of minutes from the consultant's formal discharge approval to the patient leaving the clinical unit, divided by patients discharged; minutes; source: discharge order and bed-release time stamps
- Medical records with incomplete or improper consent: such records divided by discharges and deaths, x 100; percentage; source: medical records audit against the consent checklist
- Stock-outs of emergency medications: count of stock-out instances; number; source: stock-out register in pharmacy, stores and wards, or pharmacy stock data against the emergency drug list
Patient safety indicators (PSQ.3.d)
- Variations observed in mock drills: total variations recorded; number; source: drill checklist, including tabletop exercises
- Incidence of patient falls: falls divided by in-patient days, x 1,000; per 1,000 patient days; source: incident module and midnight census
- Near misses: near misses reported divided by incidents reported, x 100; percentage; source: incident module
- Needlestick injuries: injuries divided by average occupied beds, x 1,000; rate, reported cumulatively year to date; source: occupational health register and daily census
- Appropriate handovers during shift change: handovers done appropriately divided by handover opportunities, x 100, captured separately for doctors and nurses; percentage; source: handover template (for example SBAR) completeness
- Safe and rational prescriptions: safe and rational prescriptions divided by prescriptions audited, x 100, outpatients only; percentage; source: prescription audit as per NABH's methodology
The definitions that cause rework
Most rework comes from a handful of rules in the annexure remarks.
- The initial assessment clock starts when the patient reaches the ward bed, not at admission desk registration, and stops when chief complaint, history, examination and diagnosis are documented. Later edits must not move the end time stamp.
- OPD waiting time ends when the consultant begins, not a junior doctor or resident. For appointment patients the clock starts at the appointment time, and a patient seen early counts as zero minutes.
- Discharge time starts at the consultant's formal approval. Time the patient asks for to leave is not added.
- Unplanned return to OT for December is reported in January using November's surgeries, so complications have 30 days to surface.
- SSI rates for a month are preliminary at first and change as the 30-day and 90-day surveillance windows close. Report them that way rather than freezing an incomplete number.
- Reporting errors count each changed result, not each report. Two revised results in one report of ten tests is two errors.
- Stock-outs count instances. Two drugs out on the 7th and one on the 24th is a value of two.
- Needlestick injuries are reported year to date, so the December figure is the annual rate.
Sampling for the audit-based indicators
Several indicators cannot come from transaction data and need sampling: safety precautions in diagnostics, medication errors, safe surgery checklist adherence, hand hygiene, initial assessment time when captured by audit, and prescription audit. The annexure specifies stratified random sampling and gives a monthly sample size table. The screening population is the average monthly volume of the previous three months.
- 100 gives a sample of 79
- 200 gives 132
- 500 gives 217
- 1,000 gives 278
A hospital averaging 200 admissions a month that measures initial assessment by audit samples 132 patients, spread through the month. If the HIS captures both time stamps, no sampling is needed, but it should report how many records could not be timed.
A worked example (illustrative)
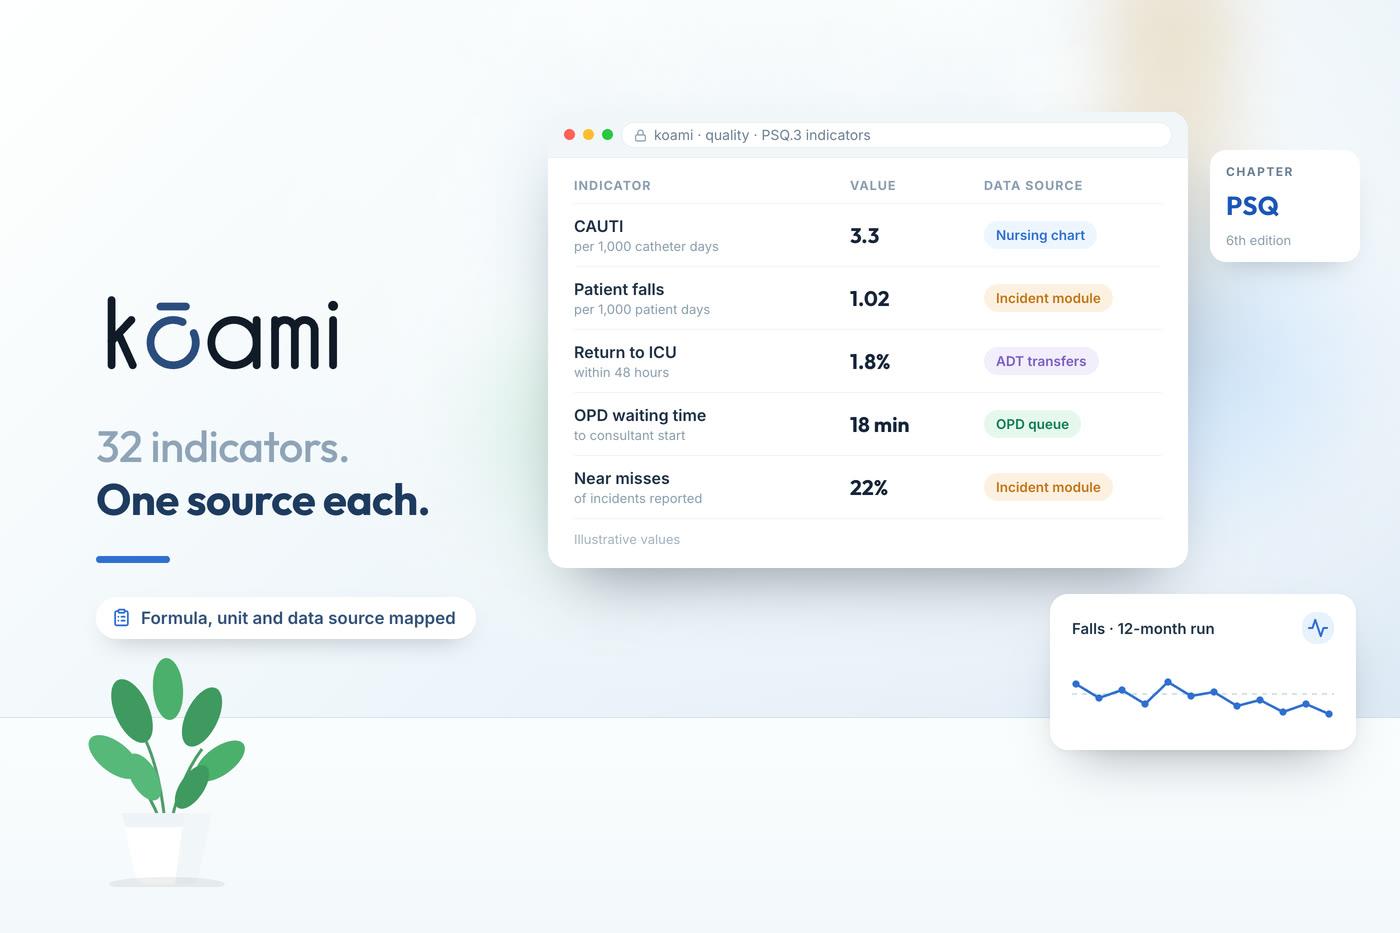
Take a 120-bed hospital in September with 2,950 in-patient days, 3 patient falls and 41 incidents reported, of which 9 were near misses. All figures here are illustrative.
- Falls: 3 divided by 2,950, x 1,000 = 1.02 per 1,000 patient days
- Near misses: 9 divided by 41, x 100 = 22 percent
- Urinary catheter days from nursing charting: 610, with 2 CAUTIs: 2 divided by 610, x 1,000 = 3.3 per 1,000 catheter days
The arithmetic is trivial. The work is agreeing that 2,950 is the right census, that catheter days were counted daily rather than estimated at month end, and that every fall reached the incident module. That is PSQ.3.e in practice.
Indicators most hospitals add
ALOS, bed occupancy and staff attrition are not in the annexure, but management reviews ask for them. Fix their definitions once:
- ALOS: in-patient days divided by discharges including deaths, for the same period
- Bed occupancy: in-patient days divided by (available beds x days in the period), x 100
- Staff attrition: leavers in the period divided by average headcount, x 100, by cadre
Our pieces on hospital cycle time KPIs and MIS dashboards cover how these sit alongside operational metrics.
Automate the time stamps, keep the audits honest
Most of the 32 indicators are counts or time differences that a connected HIMS already records: ward arrival, assessment completion, transfer in and out of ICU, device insertion and removal, OT bookings, blood bank request and release, OPD queue, discharge approval and bed release. When those come from the same patient record, the indicator is a query, not a collection exercise. Kōami is designed so that these events are written once by the person doing the work and the indicator report reads them directly, with a manual-entry field for the numerators that only an audit can produce.
The rest are observational and should stay that way. A hand hygiene figure nobody watched is not a measurement. For those, use a mobile audit form, a sampling plan and an observer from outside the department.
A monthly review routine that survives assessments
- Day 1 to 2: lock last month's census, device days and transaction-based indicators. No edits after lock without a logged reason.
- Day 3 to 4: quality team verifies a sample of numerators against source records, as PSQ.3.e requires. Record what was checked.
- Day 5 to 7: department heads review their indicators and note causes for any movement outside the expected range.
- By day 10: quality committee reviews trends, not single months, using run charts. Each action gets an owner and a date.
- Quarterly: close out actions, recalculate SSI with complete surveillance windows, and share feedback with staff (PSQ.3.h).
An assessor asks less whether you collect an indicator than what you did when it moved. Minutes, an action log and next month's number answer that. For the wider picture, see our NABH accreditation guide.
If you want to see how indicator data can be captured inside daily work instead of chased at month end, our NABH accreditation software page shows the workflow, and we are happy to walk through it on synthetic data. Book a demo: koami.in/book-demo
Frequently asked questions
- How many quality indicators does the NABH 6th edition require?
- The Key Performance Indicators annexure of the 6th edition hospital standard lists 32 indicators that every hospital monitors, plus department-specific clinical indicators that become mandatory when that specialty is in the hospital's scope. NABH's own KPI training page describes these as 32 mandatory organisational KPIs and 18 department-specific clinical indicators.
- Which NABH chapter covers quality indicators?
- Patient Safety and Quality Improvement (PSQ). Standard PSQ.3 asks the hospital to identify and monitor key indicators for clinical care (PSQ.3.a), infection prevention and control (PSQ.3.b), managerial processes (PSQ.3.c) and patient safety (PSQ.3.d), and to verify, analyse and act on the data.
- Can NABH indicators be calculated automatically from the HIS?
- Most of the time-stamp and count indicators can, and the annexure gives guidance on capturing them from the HIS or EMR. Where the system cannot collate a numerator or denominator, the annexure asks that there is at least a provision for manual entry so the indicator value is still calculated automatically. Audit-based indicators such as hand hygiene or safety checklist adherence still need observers.
- How big should the sample be for audit-based NABH indicators?
- The annexure has a monthly sample size table based on a screening population, which is the average monthly volume of the previous three months. For example, a screening population of 200 needs a sample of 132, and 500 needs 217, taken on a continuous basis through the month.
- Are ALOS and bed occupancy NABH mandatory indicators?
- They are not among the 32 indicators in the 6th edition annexure, but most hospitals track them for management review. Keep their definitions written down so the numbers stay comparable month to month.
Sources
- NABH Accreditation Standards for Hospitals, 6th Edition (effective 1 January 2025), PSQ chapter and Key Performance Indicators annexure
- NABH: Key Performance Indicators (KPI) Training, 6th Edition Hospital Standards
- CDC NHSN Patient Safety Component (CLABSI, CAUTI, VAE and SSI surveillance definitions)
- WHO Surgical Safety Checklist
- WHO Hand Hygiene Monitoring Tools
Follow Kōami on LinkedIn
Get the next guide on hospital operations, software and compliance in your feed, as soon as it is published.